


Understood Care
Patient Advocacy Without the Call Center
The data layer behind our Oklahoma guide and all 58 city pages, in one place: CMS enrollment, Census demographics, and federal shortage designations, county by county.
Coverage data 2024. Plan networks change - we confirm exactly what your plan covers before any work begins.
Counties covered by our city pages (34 counties, 686,770 beneficiaries). Each county links to its anchor city page.
| County | Medicare beneficiaries | Medicare Advantage share | Dual-eligible | Residents 65+ | Shortage designations |
|---|---|---|---|---|---|
| Oklahoma County | 145,806 | 44.7% | 22,524 | 113,476 | 8 |
| Tulsa County | 128,322 | 50.9% | 16,997 | 100,090 | 8 |
| Cleveland County | 52,417 | 40.2% | 5,363 | 43,014 | 3 |
| Canadian County | 28,329 | 41.8% | 2,413 | 21,889 | 2 |
| Comanche County | 21,659 | 33.6% | 3,339 | 16,288 | 4 |
| Rogers County | 20,525 | 48.3% | 2,006 | 16,444 | 1 |
| Wagoner County | 17,719 | 50.2% | 1,691 | 14,253 | 3 |
| Creek County | 17,114 | 56.1% | 2,491 | 13,232 | 2 |
| Pottawatomie County | 16,726 | 44.7% | 2,896 | 12,035 | 4 |
| Muskogee County | 16,250 | 39.8% | 3,266 | 11,320 | 2 |
| Payne County | 13,856 | 23.7% | 1,759 | 10,743 | 2 |
| Washington County | 12,895 | 36.4% | 1,586 | 10,592 | 2 |
| Garfield County | 12,827 | 28.2% | 1,929 | 10,363 | 1 |
| Le Flore County | 11,795 | 42% | 2,441 | 8,679 | 3 |
| Carter County | 11,479 | 34.7% | 1,843 | 8,165 | 4 |
| Grady County | 11,471 | 37.3% | 1,525 | 9,355 | 0 |
| Stephens County | 11,206 | 25% | 1,784 | 8,833 | 1 |
| Kay County | 10,749 | 35.5% | 1,799 | 8,384 | 4 |
| Pittsburg County | 10,672 | 36.1% | 1,861 | 8,696 | 5 |
| Sequoyah County | 10,475 | 44.6% | 2,394 | 7,347 | 2 |
| Bryan County | 10,387 | 34.5% | 1,824 | 8,200 | 3 |
| Cherokee County | 10,279 | 37.3% | 1,749 | 8,335 | 8 |
| McClain County | 10,035 | 38.3% | 1,042 | 6,750 | 1 |
| Mayes County | 9,964 | 46.8% | 1,543 | 7,368 | 2 |
| Logan County | 9,843 | 41.6% | 1,109 | 8,583 | 3 |
| Okmulgee County | 9,278 | 49.4% | 1,852 | 6,789 | 4 |
| Pontotoc County | 8,416 | 30.1% | 1,543 | 6,479 | 2 |
| Ottawa County | 8,147 | 46.3% | 1,559 | 5,489 | 6 |
| McCurtain County | 7,376 | 29.4% | 1,699 | 5,494 | 5 |
| Custer County | 5,081 | 26.6% | 701 | 4,039 | 2 |
| Jackson County | 4,720 | 24.4% | 830 | 3,818 | 1 |
| Beckham County | 4,344 | 22.3% | 757 | 3,234 | 2 |
| Woodward County | 3,902 | 22% | 479 | 3,277 | 1 |
| Texas County | 2,706 | 17.6% | 298 | 2,520 | 2 |
Statewide, 41.4% of beneficiaries chose Medicare Advantage in 2025. Counties above that line see more prior authorizations and more denials worth appealing; counties below it lean on Medigap rights, which in Oklahoma are unusually strong: a birthday rule (a 60-day guaranteed-issue window each year starting on your birthday, in place since September 2023) and a state-mandated guaranteed-issue right for at least one plan for beneficiaries under 65 who qualify through disability, on top of the federal window at 65. About 10.2% of Oklahoma seniors live below the poverty line, the group most likely to qualify for unclaimed help: Extra Help and the Medicare Savings Programs. For the full rundown, sources included, see our Oklahoma patient advocacy hub.
One dedicated advocate for the bills, appeals, appointments, and paperwork, serving every Oklahoma county virtually, covered by Medicare.
Or start from your city: every Oklahoma city we serve.

Learn how to improve provider access, find in-network doctors and specialists, use tele-health, and have Understood Care advocates handle referrals and appointments for you.
Read more
Learn how PACE program food benefits, Medicare PACE meal delivery, and PACE vs nursing home food and housing options can help older adults safely age in place.
Read more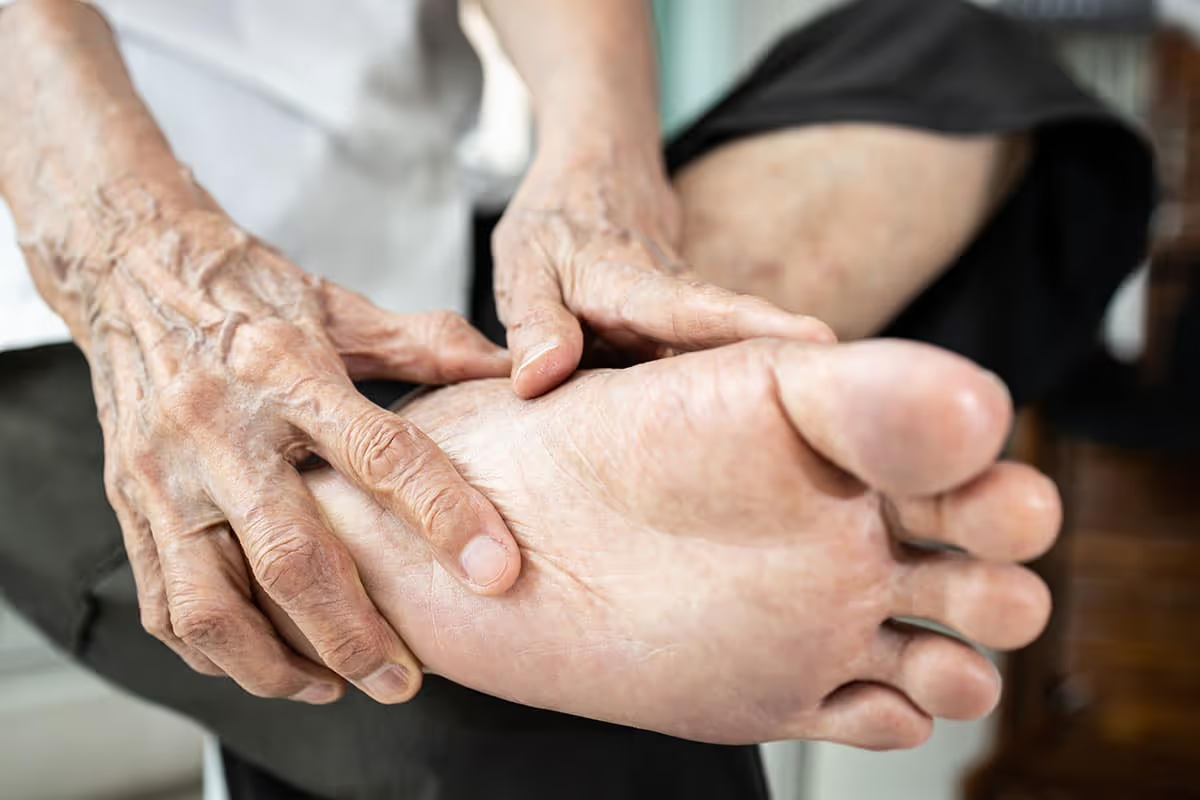
Beat neuropathy pain with medicines like gabapentin and duloxetine, topicals, therapy, footwear, and advocate help with authorizations and mobility support.
Read moreSources: CMS Medicare Monthly Enrollment (2025); US Census Bureau ACS 2023 5-year; CMS Care Compare Timely & Effective Care (median ER minutes, period ending 09/30/2025); HRSA Health Professional Shortage Area designation file. Data retrieved 2026-09-04. Understood Care is an independent private advocacy service, not a government agency.