


Understood Care
Patient Advocacy Without the Call Center
The data layer behind our Oregon guide and all 58 city pages, in one place: CMS enrollment, Census demographics, and federal shortage designations, county by county.
Coverage data 2025. Plan networks change - we confirm exactly what your plan covers before any work begins.
The 28 of Oregon's 36 counties that our city pages cover, with 948,322 beneficiaries. Each county links to its anchor city page.
| County or city | Medicare beneficiaries | Medicare Advantage share | Dual-eligible | Residents 65+ | Shortage designations |
|---|---|---|---|---|---|
| Multnomah County | 137,109 | 66% | 31,380 | 115,661 | 15 |
| Washington County | 104,607 | 64.3% | 15,130 | 86,005 | 2 |
| Clackamas County | 97,625 | 66.4% | 12,160 | 81,683 | 5 |
| Lane County | 96,953 | 63.3% | 17,860 | 78,251 | 7 |
| Marion County | 71,448 | 65% | 14,138 | 56,857 | 11 |
| Jackson County | 61,367 | 48.8% | 10,819 | 51,035 | 3 |
| Deschutes County | 52,316 | 41.5% | 6,074 | 42,327 | 2 |
| Douglas County | 36,302 | 50.9% | 7,157 | 29,330 | 10 |
| Linn County | 32,740 | 61.7% | 6,149 | 24,878 | 2 |
| Josephine County | 28,633 | 56.8% | 5,886 | 23,599 | 2 |
| Yamhill County | 24,569 | 58.9% | 3,821 | 19,811 | 2 |
| Coos County | 21,919 | 25.2% | 4,741 | 17,750 | 4 |
| Polk County | 20,419 | 64.4% | 2,984 | 16,628 | 2 |
| Benton County | 19,539 | 52.9% | 2,351 | 16,549 | 2 |
| Klamath County | 18,863 | 41.2% | 4,183 | 15,411 | 3 |
| Lincoln County | 18,376 | 34.6% | 3,156 | 15,765 | 3 |
| Umatilla County | 15,962 | 5.1% | 3,582 | 12,946 | 7 |
| Columbia County | 13,644 | 61% | 2,126 | 10,440 | 3 |
| Clatsop County | 11,723 | 7.1% | 2,050 | 10,046 | 4 |
| Curry County | 9,950 | 7.4% | 1,752 | 8,345 | 1 |
| Tillamook County | 8,869 | 13.1% | 1,434 | 7,527 | 7 |
| Crook County | 8,214 | 42.2% | 1,244 | 6,437 | 3 |
| Union County | 6,892 | 6.2% | 1,179 | 5,500 | 6 |
| Wasco County | 6,682 | 32.4% | 1,247 | 5,560 | 4 |
| Malheur County | 6,533 | 34.2% | 1,728 | 5,405 | 3 |
| Jefferson County | 6,461 | 41.6% | 1,297 | 4,935 | 3 |
| Baker County | 5,470 | 16.9% | 998 | 4,643 | 3 |
| Hood River County | 5,137 | 34.2% | 728 | 4,248 | 2 |
Statewide, 54.3% of beneficiaries chose Medicare Advantage in 2025. Counties above that line see more prior authorizations and more denials worth appealing; counties below it lean on Medigap, where Oregon's birthday rule lets members switch each year, from 30 days before to 30 days after their birthday, to a policy with the same or lesser benefits from any company, with no health questions. About 9.4% of Oregon seniors live below the poverty line, the group most likely to qualify for unclaimed help: Extra Help and Oregon's Medicare Savings Programs, which the Oregon Department of Human Services decides on income alone, with no asset limit for QMB, SLMB, or QI. For the full rundown, sources included, see our Oregon patient advocacy hub.
One dedicated advocate for the bills, appeals, appointments, and paperwork, serving all 36 Oregon counties virtually, covered by Medicare.
Or start from your city: every Oregon city we serve.
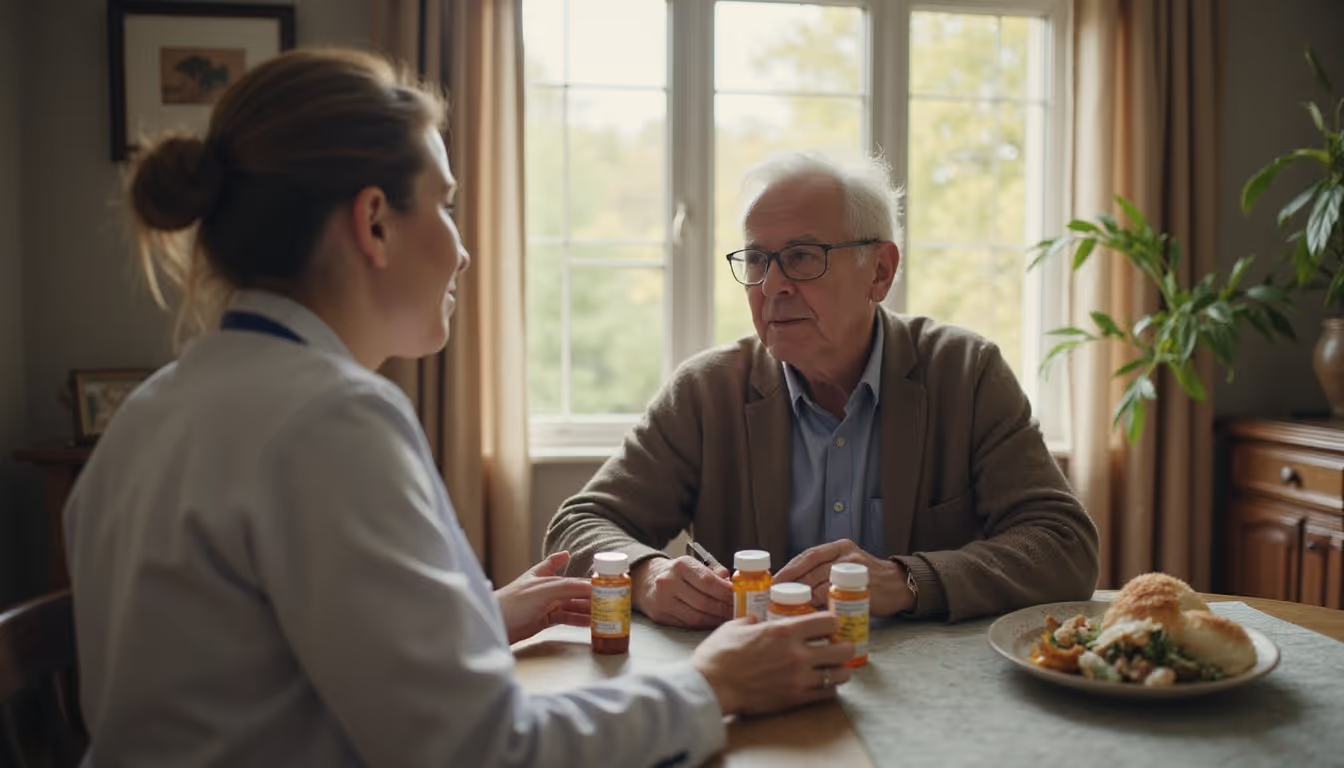
Prep for visits, ask clear questions, use teach back, review medicines, and follow up so you can have confident, safe conversations with your care team.
Read more
Learn how to live boldly with muscular dystrophy with practical tips on daily life, mobility, breathing, and caregiving so you can stay safer and more independent.
Read more
Practical guide to spot health issues, prepare for visits, understand tests, recognize urgent warning signs, and partner effectively with your care team.
Read moreSources: CMS Medicare Monthly Enrollment (2025); US Census Bureau ACS 2023 5-year; CMS Care Compare Timely & Effective Care (median ER minutes, period ending 09/30/2025); HRSA Health Professional Shortage Area designation file. Data retrieved 2026-10-20. Understood Care is an independent private advocacy service, not a government agency.