


Understood Care
Patient Advocacy Without the Call Center
The data layer behind our Ohio guide and all 57 city pages, in one place: CMS enrollment, Census demographics, and federal shortage designations, county by county.
Coverage data 2024-2025. Plan networks change - we confirm exactly what your plan covers before any work begins.
Counties covered by our city pages (33 counties, 1,940,300 beneficiaries). Each county links to its anchor city page.
| County | Medicare beneficiaries | Medicare Advantage share | Dual-eligible | Residents 65+ | Shortage designations |
|---|---|---|---|---|---|
| Cuyahoga County | 275,578 | 58.3% | 56,683 | 237,668 | 12 |
| Franklin County | 205,853 | 57% | 37,478 | 167,986 | 14 |
| Hamilton County | 161,849 | 57.2% | 28,528 | 134,151 | 11 |
| Summit County | 124,156 | 64.1% | 20,887 | 102,113 | 9 |
| Montgomery County | 118,195 | 61.3% | 20,381 | 98,025 | 4 |
| Stark County | 94,736 | 68.1% | 14,074 | 75,100 | 4 |
| Lucas County | 92,221 | 58.7% | 18,314 | 73,314 | 9 |
| Lorain County | 76,329 | 58% | 9,749 | 60,992 | 5 |
| Butler County | 75,049 | 56.3% | 10,968 | 60,535 | 3 |
| Mahoning County | 60,222 | 65.1% | 12,224 | 50,002 | 4 |
| Lake County | 60,150 | 55.1% | 5,845 | 48,896 | 5 |
| Trumbull County | 53,190 | 62.8% | 8,566 | 44,363 | 2 |
| Warren County | 46,521 | 53.6% | 3,947 | 37,771 | 5 |
| Medina County | 43,826 | 56.3% | 3,518 | 35,200 | 1 |
| Delaware County | 41,584 | 48.3% | 3,215 | 32,507 | 1 |
| Licking County | 38,385 | 56.5% | 4,776 | 30,851 | 1 |
| Greene County | 36,558 | 50% | 4,161 | 30,665 | 2 |
| Fairfield County | 32,360 | 58.8% | 4,110 | 26,447 | 4 |
| Clark County | 31,878 | 60.4% | 5,515 | 27,115 | 2 |
| Richland County | 30,324 | 52.8% | 5,181 | 24,763 | 4 |
| Wood County | 27,287 | 52.2% | 2,875 | 21,390 | 3 |
| Wayne County | 26,091 | 56% | 3,216 | 21,693 | 0 |
| Allen County | 23,548 | 50.6% | 4,042 | 18,988 | 3 |
| Muskingum County | 21,954 | 56.6% | 4,782 | 15,794 | 1 |
| Erie County | 21,416 | 49.2% | 2,840 | 17,265 | 4 |
| Ross County | 17,254 | 56.5% | 3,371 | 13,432 | 4 |
| Jefferson County | 17,162 | 52% | 2,851 | 14,341 | 1 |
| Scioto County | 17,056 | 50.2% | 4,250 | 13,529 | 4 |
| Hancock County | 16,489 | 46.2% | 2,044 | 13,726 | 2 |
| Washington County | 16,334 | 44.4% | 2,696 | 12,866 | 1 |
| Marion County | 15,002 | 57.8% | 2,847 | 11,958 | 3 |
| Athens County | 11,458 | 51.9% | 2,309 | 9,053 | 1 |
| Shelby County | 10,285 | 38.5% | 1,176 | 8,440 | 0 |
Statewide, 56.7% of beneficiaries chose Medicare Advantage in 2025. Counties above that line see more prior authorizations and more denials worth appealing; counties below it lean on Medigap rights, which in Ohio follow the federal rule at 65 (one guaranteed six-month window, no birthday rule, no year-round switching) and, unlike some states, add no under-65 guaranteed-issue right, so timing at 65 matters even more. About 9.5% of Ohio seniors live below the poverty line, the group most likely to qualify for unclaimed help: Extra Help and the Medicare Savings Programs. For the full rundown, sources included, see our Ohio patient advocacy hub.
One dedicated advocate for the bills, appeals, appointments, and paperwork, serving every Ohio county virtually, covered by Medicare.
Or start from your city: every Ohio city we serve.
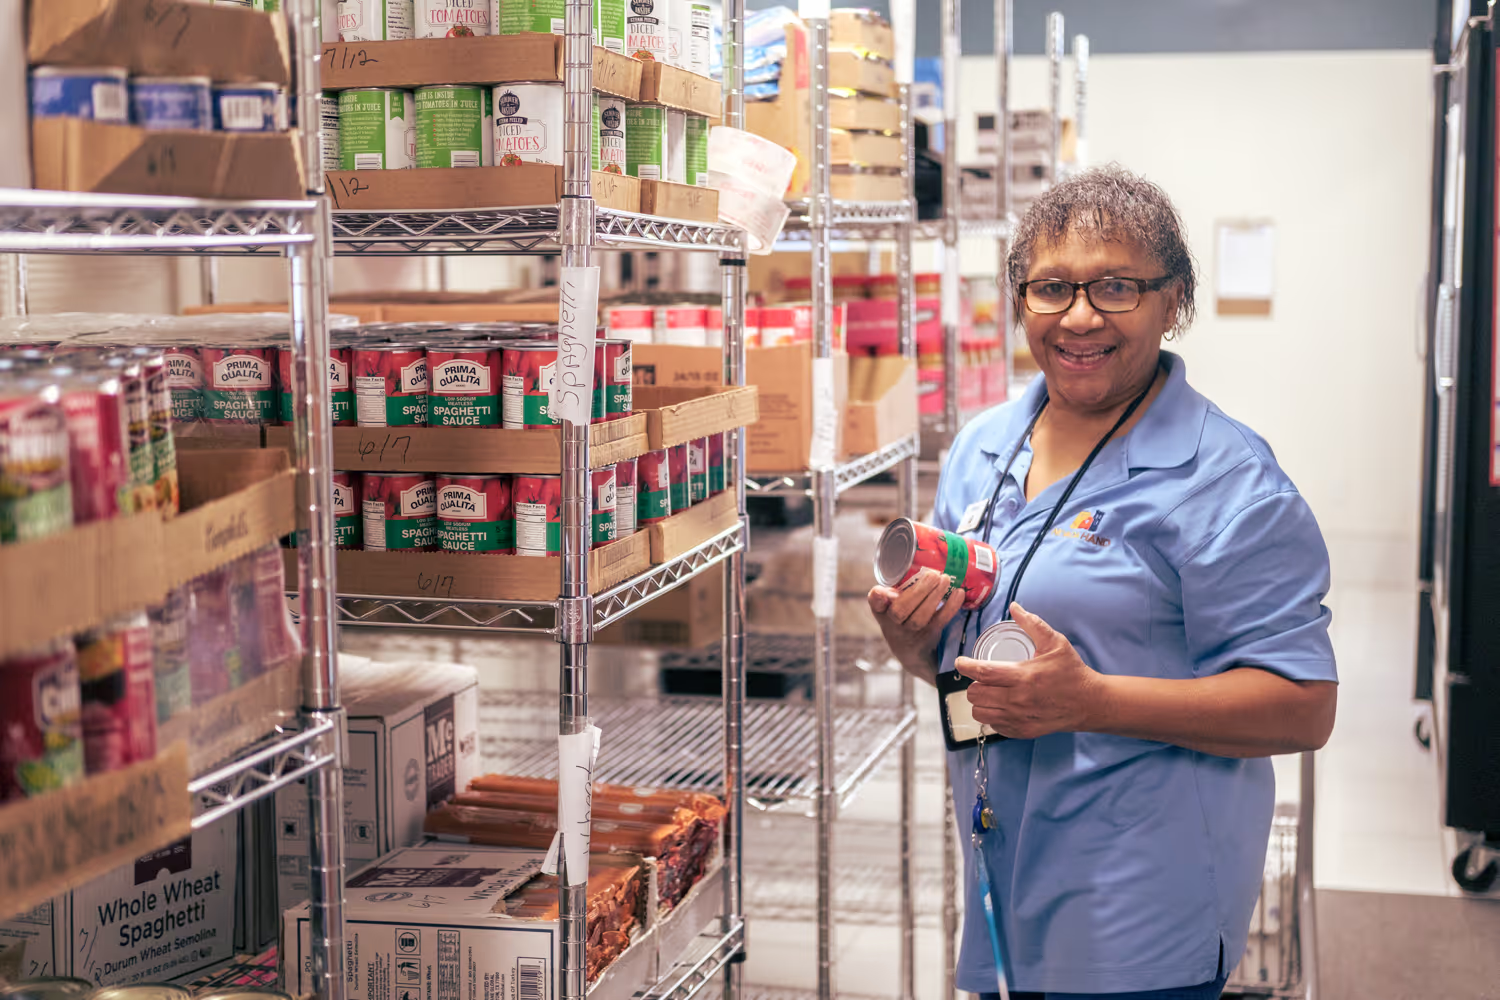
Use this checklist to gather documents for food assistance (SNAP) and housing help (Section 8, public housing, emergency rental assistance). Learn what IDs, income proof, and housing records you may need to avoid delays.
Read more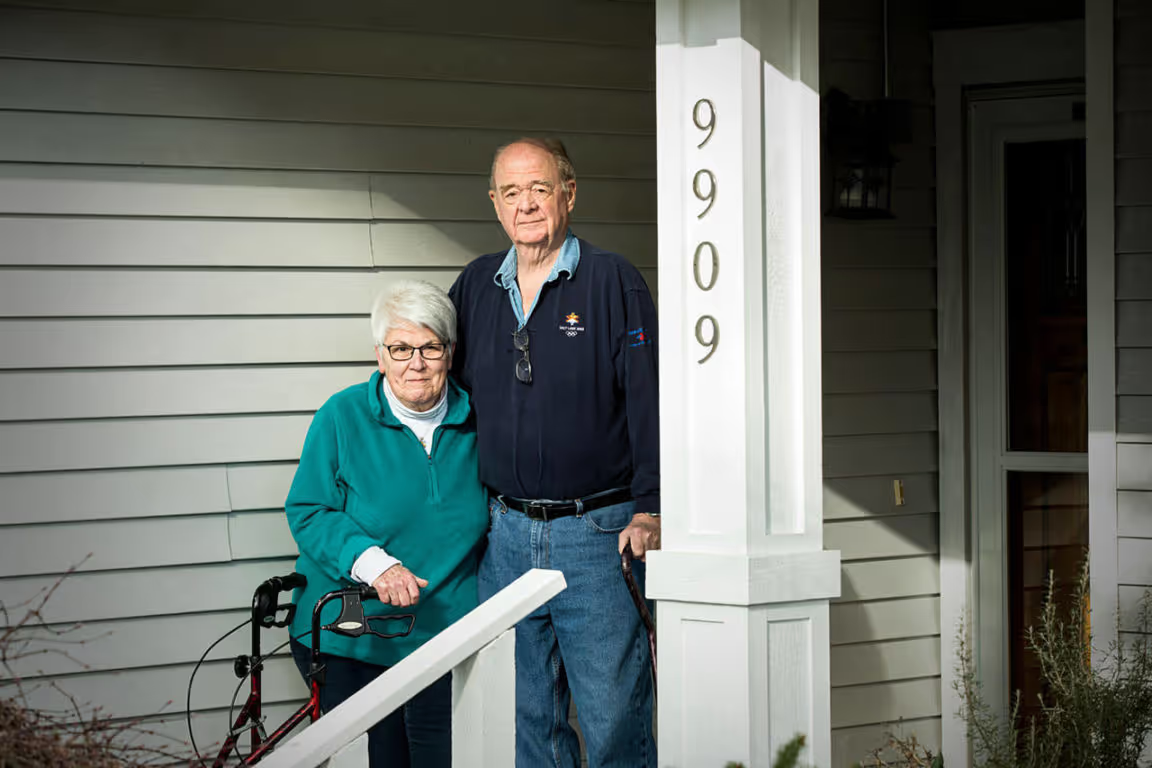
Does a Medicare Advantage flex card for rent count as income in HUD housing? Learn HUD’s 2025 rule.
Read more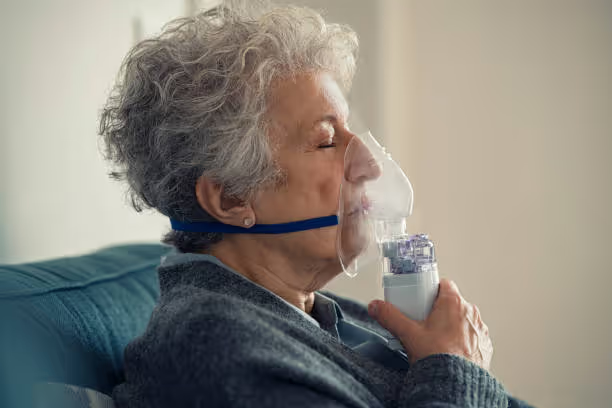
Learn how Medicare covers home oxygen, portable oxygen, and nebulizers, what paperwork you need, and how advocates help you avoid delays and breathe easier.
Read moreSources: CMS Medicare Monthly Enrollment (2025); US Census Bureau ACS 2023 5-year; CMS Care Compare Timely & Effective Care (median ER minutes, period ending 06/30/2025); HRSA Health Professional Shortage Area designation file. Data retrieved 2026-08-07. Understood Care is an independent private advocacy service, not a government agency.